...real vs nominal...
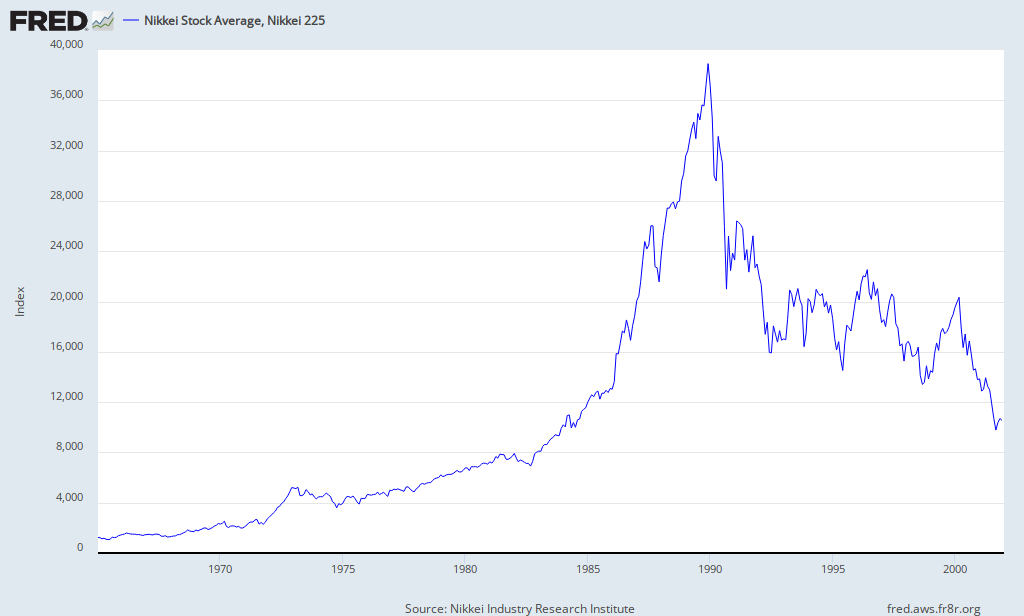
Matt Yglesias has a Slate post on the 1987-91 Nikkei bubble. His core graph, drawn from the St. Louis FRED database, is on the left; I've shorted the time period to go from 1965 through 2001 to match the SNA1968 nominal GDP time series. The same series, divided by nominal GDP, is below. The same series, divided by nominal GDP, is below. There’s still quite a bubble, but relative to GDP stock prices had been even higher in the early 1960s — and except around the time of the oil crisis tracked nominal GDP from 1967 until 1985.

...mike smitka...
[Data: for nominal GDP I used the seasonally corrected series available at the Economic and Social Research Institute. I set the nominally adjusted series equal to the Nikkei series for 2013.Q1. I used the SNA93 series from 1994.Q1 and the SNA68 series for all earlier dates, again adjusting so that the old SNA series would generate the same point in the first observation where they overlap.]
No comments:
Post a Comment